What is proactive tuning and reactive tuning?
In Proactive Tuning, the application designers can then determine which combination of system resources and available Oracle features best meet the needs during design and development.In reactive tuning the bottom up approach is used to find and fix the bottlenecks. The goal is to make Oracle run faster.
Describe the level of tuning in oracle?
System-level tuning involves the following steps:
-Monitoring the operating system counters using a tool such as top, gtop, and GKrellM or the VTune analyzer’s counter monitor data collector for applications running on Windows.
-Interpreting the counter data to locate system-level performance bottlenecks and opportunities for improving the way your application interacts with the system.
-SQL-level tuning:Tuning disk and network I/O subsystem to optimize the I/O time, network packet size and dispatching frequency is called the server kernel optimization.
Distribution of data can be studied by the optimizer by collecting and storing optimizer statistics. This enables intelligent execution plans. Choice of db_block_size, db_cache_size, and OS parameters (db_file_multiblock_read_count, cpu_count, &c), can influence SQL performance. Tuning SQL Access workload with physical indexes and materialized views.
What is Database design level tuning?
The steps involved in database design level tuning are:
Determination of the data needed by an application (what relations are important, their attributes and structuring the data to best meet the performance goals)
Analysis of data followed by normalization to eliminate data redundancy.
Avoiding data contention.
Localizing access to the data to the partition, process and instance levels.
Using synchronization points in Oracle Parallel Server.
Implementation of 8i enhancements that can help avoid contention are:
Consideration on partitioning the data
Consideration over using local or global indexes.
Explain rule-based optimizer and cost-based optimizer.?
Oracle decides how to retrieve the necessary data whenever a valid SQL statement is processed.This decision can be made using one of two methods:
Rule Based Optimizer
If the server has no internal statistics relating to the objects referenced by the statement then the RBO method is used.This method will be deprecated in the future releases of oracle.
Cost Based Optimizer
The CBO method is used if internal statistics are present.The CBO checks several possible execution plans and selects the one with the lowest cost based on the system resources.
What are object datatypes? Explain the use of object datatypes.?
Object data types are user defined data types. Both column and row can represent an object type. Object types instance can be stored in the database. Object datatypes make it easier to work with complex data, such as images, audio, and video. Object types provide higher-level ways to organize and access data in the database.The SQL attributes of Select into clause, i.e. SQL % Not found, SQL % found, SQL % Isopen, SQL %Rowcount.
1.% Not found: True if no rows returned
E.g. If SQL%NOTFOUND then return some_value
2.% found: True if at least one or more rows returned
E.g. If SQL%FOUND then return some_value
3.%Isopen: True if the SQL cursor is open. Will always be false, because the database opens and closes the implicit cursor used to retrieve the data
4.%Rowcount: Number of rows returned. Equals 0 if no rows were found (but the exception is raised) and a 1, if one or more rows are found (if more than one an exception is raised).
What is translate and decode in oracle?
Translate: translate function replaces a sequence of characters in a string with another set of characters. The replacement is done single character at a time.
Syntax:
translate( string1, string_to_replace, replacement_string )
translate( string1, string_to_replace, replacement_string )
Example:
translate (‘1tech23’, ‘123’, ‘456);
translate (‘1tech23’, ‘123’, ‘456);
Decode: The DECODE function compares one expression to one or more other expressions and, when the base expression is equal to a search expression, it returns the corresponding result expression; or, when no match is found, returns the default expression when it is specified, or NA when it is not.
Syntax:
DECODE (expr , search, result [, search , result]… [, default])
DECODE (expr , search, result [, search , result]… [, default])
Example:
SELECT employee_name, decode(employee_id, 10000, ‘tom’, 10001, ‘peter’, 10002, ‘jack’ ‘Gateway’) result FROM employee;
SELECT employee_name, decode(employee_id, 10000, ‘tom’, 10001, ‘peter’, 10002, ‘jack’ ‘Gateway’) result FROM employee;
What is oracle correlated sub-queries? Explain with an example?
A query which uses values from the outer query is called as a correlated sub query. The subquery is executed once and uses the results for all the evaluations in the outer query.Example:
Here, the sub query references the employee_id in outer query. The value of the employee_id changes by row of the outer query, so the database must rerun the subquery for each row comparison. The outer query knows nothing about the inner query except its results.
Here, the sub query references the employee_id in outer query. The value of the employee_id changes by row of the outer query, so the database must rerun the subquery for each row comparison. The outer query knows nothing about the inner query except its results.
select employee_id, appraisal_id, appraisal_amount From employee
where
appraisal_amount < (select max(appraisal_amount)
from employee e
where employee_id = e. employee_id);
where
appraisal_amount < (select max(appraisal_amount)
from employee e
where employee_id = e. employee_id);
Explain union and intersect with examples?
-UNION: The UNION operator is used to combine the result-set of two or more SELECT statements Tables of both the select statement must have the same number of columns with similar data types. It eliminates duplicates.
Syntax:
SELECT column_name(s) FROM table_name1
UNION
SELECT column_name(s) FROM table_name2
SELECT column_name(s) FROM table_name1
UNION
SELECT column_name(s) FROM table_name2
Example:
SELECT emp_Name FROM Employees_india
UNION
SELECT emp_Name FROM Employees_USA
SELECT emp_Name FROM Employees_india
UNION
SELECT emp_Name FROM Employees_USA
-INTERSECT allows combining results of two or more select queries. If a record exists in one query and not in the other, it will be omitted from the INTERSECT results.
What is difference between open_form and call_form? What is new_form built-in in oracle form?
Open_form opens the indicated form. Call_form not just opens the indicated form, but also keeps the parent form alive.When new_form is called, the new indicted form is opened and the old one is exited by releasing the memory. The new form is run using the same Run form options as the parent form.
What is the difference between DBFile Sequential and Scattered Reads?
Both “db file sequential read” and “db file scattered read” events signify time waited for I/O read requests to complete. Time is reported in 100’s of a second for Oracle 8i releases and below, and 1000’s of a second for Oracle 9i and above. Most people confuse these events with each other as they think of how data is read from disk. Instead they should think of how data is read into the SGA buffer cache.
db file sequential read:
A sequential read operation reads data into contiguous memory (usually a single-block read with p3=1, but can be multiple blocks). Single block I/Os are usually the result of using indexes. This event is also used for rebuilding the controlfile and reading datafile headers (P2=1). In general, this event is indicative of disk contention on index reads.
db file scattered read:
Similar to db file sequential reads, except that the session is reading multiple data blocks and scatters them into different discontinuous buffers in the SGA. This statistic is NORMALLY indicating disk contention on full table scans. Rarely, data from full table scans could be fitted into a contiguous buffer area, these waits would then show up as sequential reads instead of scattered reads.
The following query shows average wait time for sequential versus scattered reads:
prompt “AVERAGE WAIT TIME FOR READ REQUESTS”
select a.average_wait “SEQ READ”, b.average_wait “SCAT READ”
from sys.v_$system_event a, sys.v_$system_event b
where a.event = ‘db file sequential read’
and b.event = ‘db file scattered read’;
select a.average_wait “SEQ READ”, b.average_wait “SCAT READ”
from sys.v_$system_event a, sys.v_$system_event b
where a.event = ‘db file sequential read’
and b.event = ‘db file scattered read’;
Explain about performance tuning enhancements?
Oracle includes many performance tuning enhancements like:
-Automatic Performance Diagnostic and Tuning Features
-Automatic Shared Memory Management – Automatic Shared Memory Management puts Oracle in control of allocating memory within the SGA
-Wait Model Improvements – A number of views have been updated and added to improve the wait model.
-Automatic Optimizer Statistics Collection – gathers optimizer statistics using a scheduled job called GATHER_STATS_JOB
-Dynamic Sampling – enables the server to improve performance
-CPU Costing – default cost model for the optimizer (CPU+I/O), with the cost unit as time Optimizer Hints
-Rule Based Optimizer Obsolescence – No more used
-Tracing Enhancements – End to End Application Tracing which allows a client process to be identified via the client identifier rather than the typical session id
-SAMPLE Clause Enhancements Hash Partitioned Global Indexes
You see multiple fragments in the SYSTEM tablespace, what should you check first?
Ensure that users don’t have the SYSTEM tablespace as their TEMPORARY or DEFAULT tablespace assignment by checking the DBA_USERS view.
What are some indications that you need to increase the SHARED_POOL_SIZE parameter?
Poor data dictionary or library cache hit ratios, getting error ORA-04031. Another indication is steadily decreasing performance with all other tuning parameters the same.
When should you increase copy latches? What parameters control copy latches?
When you get excessive contention for the copy latches as shown by the “redo copy” latch hit ratio. You can increase copy latches via the initialization parameter LOG_SIMULTANEOUS_COPIES to twice the number of CPUs on your system.
If you see statistics that deal with “undo” what are they really talking about?
Rollback segments and associated structures.
If a table space has a default pct increase of zero what will this cause (in relationship to the smon process)?
The SMON process won’t automatically coalesce its free space fragments.
How can you tell if a tablespace has excessive fragmentation?
If a select against the dba_free_space table shows that the count of a tablespaces extents is greater than the count of its data files, then it is fragmented.
Why and when should one tune?
One of the biggest responsibilities of a DBA is to ensure that the Oracle database is tuned properly. The Oracle RDBMS is highly tunable and allows the database to be monitored and adjusted to increase its performance.
One should do performance tuning for the following reasons:
The speed of computing might be wasting valuable human time (users waiting for response);
Enable your system to keep-up with the speed business is conducted; and Optimize hardware usage to save money (companies are spending millions on hardware).
Although this FAQ is not overly concerned with hardware issues, one needs to remember than you cannot tune a Buick into a Ferrari.
What database aspects should be monitored?
One should implement a monitoring system to constantly monitor the following aspects of a database. Writing custom scripts, implementing Oracle’s Enterprise Manager, or buying a third-party monitoring product can achieve this. If an alarm is triggered, the system should automatically notify the DBA (e-mail, page, etc.) to take appropriate action.
Infrastructure availability:
– Is the database up and responding to requests
– Are the listeners up and responding to requests
– Are the Oracle Names and LDAP Servers up and responding to requests
– Are the Web Listeners up and responding to requests
– Are the listeners up and responding to requests
– Are the Oracle Names and LDAP Servers up and responding to requests
– Are the Web Listeners up and responding to requests
Things that can cause service outages:
– Is the archive log destination filling up?
– Objects getting close to their max extents
– Tablespaces running low on free space/ Objects what would not be able to extend
– User and process limits reached
– Objects getting close to their max extents
– Tablespaces running low on free space/ Objects what would not be able to extend
– User and process limits reached
Things that can cause bad performance:
See question “What tuning indicators can one use?”.
Where should the tuning effort be directed?
Consider the following areas for tuning. The order in which steps are listed needs to be maintained to prevent tuning side effects. For example, it is no good increasing the buffer cache if you can reduce I/O by rewriting a SQL statement.
Database Design (if it’s not too late):
Poor system performance usually results from a poor database design. One should generally normalize to the 3NF. Selective denormalization can provide valuable performance improvements. When designing, always keep the “data access path” in mind. Also look at proper data partitioning, data replication, aggregation tables for decision support systems, etc.
Application Tuning:
Experience showed that approximately 80% of all Oracle system performance problems are resolved by coding optimal SQL. Also consider proper scheduling of batch tasks after peak working hours.
Memory Tuning:
Properly size your database buffers (shared pool, buffer cache, log buffer, etc) by looking at your buffer hit ratios. Pin large objects into memory to prevent frequent reloads.
Disk I/O Tuning:
Database files needs to be properly sized and placed to provide maximum disk subsystem throughput. Also look for frequent disk sorts, full table scans, missing indexes, row chaining, data fragmentation, etc.
Eliminate Database Contention:
Study database locks, latches and wait events carefully and eliminate where possible.
Tune the Operating System:
Monitor and tune operating system CPU, I/O and memory utilization. For more information, read the related Oracle FAQ dealing with your specific operating system.
What tuning indicators can one use?
The following high-level tuning indicators can be used to establish if a database is performing optimally or not:
– Buffer Cache Hit Ratio
Formula: Hit Ratio = (Logical Reads – Physical Reads) / Logical Reads
Action: Increase DB_CACHE_SIZE (DB_BLOCK_BUFFERS prior to 9i) to increase hit ratio
– Library Cache Hit Ratio
Action: Increase the SHARED_POOL_SIZE to increase hit ratio
What tools/utilities does Oracle provide to assist with performance tuning?
Oracle provide the following tools/ utilities to assist with performance monitoring and tuning:
– TKProf
– UTLBSTAT.SQL and UTLESTAT.SQL – Begin and end stats monitoring
– Statspack
– Oracle Enterprise Manager – Tuning Pack
What is STATSPACK and how does one use it?
Statspack is a set of performance monitoring and reporting utilities provided by Oracle from Oracle8i and above. Statspack provides improved BSTAT/ESTAT functionality, though the old BSTAT/ESTAT scripts are still available. For more information about STATSPACK, read the documentation in file $ORACLE_HOME/rdbms/admin/spdoc.txt.
Install Statspack:
cd $ORACLE_HOME/rdbms/admin
sqlplus “/ as sysdba” @spdrop.sql — Install Statspack –
sqlplus “/ as sysdba” @spcreate.sql– Enter tablespace names when prompted
Use Statspack:
sqlplus perfstat/perfstat
exec statspack.snap; — Take a performance snapshots
exec statspack.snap;
Get a list of snapshots
select SNAP_ID, SNAP_TIME from STATS$SNAPSHOT;
@spreport.sql — Enter two snapshot id’s for difference report
Other Statspack Scripts:
– sppurge.sql – Purge a range of Snapshot Id’s between the specified begin and end Snap Id’s
– spauto.sql – Schedule a dbms_job to automate the collection of STATPACK statistics
– spcreate.sql – Installs the STATSPACK user, tables and package on a database (Run as SYS).
– spdrop.sql – Deinstall STATSPACK from database (Run as SYS)
– sppurge.sql – Delete a range of Snapshot Id’s from the database
– spreport.sql – Report on differences between values recorded in two snapshots
– sptrunc.sql – Truncates all data in Statspack tables
When is cost based optimization triggered?
It’s important to have statistics on all tables for the CBO (Cost Based Optimizer) to work correctly. If one table involved in a statement does not have statistics, Oracle has to revert to rule-based optimization for that statement. So you really want for all tables to have statistics right away; it won’t help much to just have the larger tables analyzed.
Generally, the CBO can change the execution plan when you:
Change statistics of objects by doing an ANALYZE;
Change some initialization parameters (for example: hash_join_enabled, sort_area_size,
db_file_multiblock_read_count).
db_file_multiblock_read_count).
How can one optimize %XYZ% queries?
It is possible to improve %XYZ% queries by forcing the optimizer to scan all the entries from the index instead of the table. This can be done by specifying hints.
If the index is physically smaller than the table (which is usually the case) it will take less time to scan the entire index than to scan the entire table.
Where can one find I/O statistics per table?
The UTLESTAT report shows I/O per tablespace but one cannot see what tables in the tablespace has the most I/O.
The $ORACLE_HOME/rdbms/admin/catio.sql script creates a sample_io procedure and table to gather the required information.
After executing the procedure, one can do a simple SELECT * FROM io_per_object; to extract the required information.
My query was fine last week and now it is slow. Why?
The likely cause of this is because the execution plan has changed. Generate a current explain plan of the offending query and compare it to a previous one that was taken when the query was performing well. Usually the previous plan is not available.
Some factors that can cause a plan to change are:
Some factors that can cause a plan to change are:
– Which tables are currently analyzed? Were they previously analyzed? (ie. Was the query using RBO and now CBO?)
– Has OPTIMIZER_MODE been changed in INIT.ORA?
– Has the DEGREE of parallelism been defined/changed on any table?
– Have the tables been re-analyzed? Were the tables analyzed using estimate or compute? If estimate, what percentage was used?
– Have the statistics changed?
– Has the INIT.ORA parameter DB_FILE_MULTIBLOCK_READ_COUNT been changed?
– Has the INIT.ORA parameter SORT_AREA_SIZE been changed?
– Have any other INIT.ORA parameters been changed?
– What do you think the plan should be? Run the query with hints to see if this produces the required performance.
Why is Oracle not using the damn index?
This problem normally only arises when the query plan is being generated by the Cost Based Optimizer. The usual cause is because the CBO calculates that executing a Full Table Scan would be faster than accessing the table via the index. Fundamental things that can be checked are:
-USER_TAB_COLUMNS.NUM_DISTINCT – This column defines the number of distinct values the column holds.
-USER_TABLES.NUM_ROWS – If NUM_DISTINCT = NUM_ROWS then using an index would be preferable to doing a FULL TABLE SCAN. As the NUM_DISTINCT decreases, the cost of using an index increase thereby is making the index less desirable.
-USER_INDEXES.CLUSTERING_FACTOR – This defines how ordered the rows are in the
index. If CLUSTERING_FACTOR approaches the number of blocks in the table, the rows are ordered. If it approaches the number of rows in the table, the rows are randomly ordered. In such a case, it is unlikely that index entries in the same leaf block will point to rows in the same data blocks.
index. If CLUSTERING_FACTOR approaches the number of blocks in the table, the rows are ordered. If it approaches the number of rows in the table, the rows are randomly ordered. In such a case, it is unlikely that index entries in the same leaf block will point to rows in the same data blocks.
-Decrease the INIT.ORA parameter DB_FILE_MULTIBLOCK_READ_COUNT – A higher value will make the cost of a FULL TABLE SCAN cheaper.
-Remember that you MUST supply the leading column of an index, for the index to be used (unless you use a FAST FULL SCAN or SKIP SCANNING).
-There are many other factors that affect the cost, but sometimes the above can help to show why an index is not being used by the CBO. If from checking the above you still feel that the query should be using an index, try specifying an index hint. Obtain an explain plan of the query either using TKPROF with TIMED_STATISTICS, so that one can see the CPU utilization, or with AUTOTRACE to see the statistics. Compare this to the explain plan when not using an index.
When should one rebuild an index?
You can run the ‘ANALYZE INDEX VALIDATE STRUCTURE’ command on the affected indexes – each invocation of this command creates a single row in the INDEX_STATS view. This row is overwritten by the next ANALYZE INDEX command, so copy the contents of the view into a local table after each ANALYZE. The ‘badness’ of the index can then be judged by the ratio of ‘DEL_LF_ROWS’ to ‘LF_ROWS’.
How does one tune Oracle Wait events?
Some wait events from V$SESSION_WAIT and V$SYSTEM_EVENT views:
Event Name: Tuning Recommendation:
db file sequential read Tune SQL to do less I/O. Make sure all objects are analyzed. Redistribute I/O across disks.
buffer busy waits Increase DB_CACHE_SIZE (DB_BLOCK_BUFFERS prior to 9i)/ Analyze contention from SYS.V$BH
log buffer space Increase LOG_BUFFER parameter or move log files to faster disks
Explain how to tune the Redo log buffer?
For logging the events that took place in the database, Redo log buffer is used. That means keeping the list of changes that occurred to a particular database. The information regarding the events are stored in redo entries, which is required later to undo the changes that has been made to database.
Steps involved in tuning the Redo log buffer:
I. Using LOG_BUFFER parameter, first identify the size of the Redo log buffer.
II. Make sure that the waits must be equal to zero. If it is not, make it zero by increasing the size of the buffer.
III. Finally, determine the number of times the processes have to wait and also how long.
I. Using LOG_BUFFER parameter, first identify the size of the Redo log buffer.
II. Make sure that the waits must be equal to zero. If it is not, make it zero by increasing the size of the buffer.
III. Finally, determine the number of times the processes have to wait and also how long.
What does Database Tuning contain mainly?
The Database tuning, mainly contains Wait events and Hit ratios.
Explain the use of TKPROF?
The TKPROF is a tuning tool which is used to define the execution times for SQL statements and CPU. You can use it by first setting timed_statistics to be true in the initialization file and then making the tracing to turn on either for the session using the ALTER session command or the for the entire database through the SQL_trace parameter. Once you get the trace file, you can execute the tkprof tool across the trace file and then you can view at the result from the tkprof tool. It can also be used to extract explain plan result.
What is Latch Free Event?
The Latch free Event occurs when the latch is held by another process, when one process is waiting for it.
What kind of information can be obtained from summary advisor?
A summary advisor is nothing but a tool that is used for understanding and choosing materialized views. This can be achieved by choosing the appropriate set of materialized views for a specific workload and it also helps in getting information about activity log details, materialized view usage and materialized view recommendations.
What is the fastest query method for a table?
The fastest query method for a table is to fetch by using Row id.
What are the tools provided by oracle to assist performance tuning?
The following are the tools provided by oracle to assist performance tuning:
• SQL Performance Analyzer (SPA) is similar to Database replay, but with a few differences. It doesn’t perform the recording.
• Oracle Enterprise Manager (OEM) is a set of tools, which helps the management of all factors of an Oracle database instances, Oracle infrastructure, Oracle web servers and application servers.
• Statspack is provided by Oracle to perform reporting and monitoring.
• Automatic Workload Repository (AWR) is a tool that is built in every Oracle database and after every 60 minutes, it captures the snapshot of workloads and all key statistics in the database by default.
• TKProf is used to assess the efficiency of the SQL statements accurately during the application run.
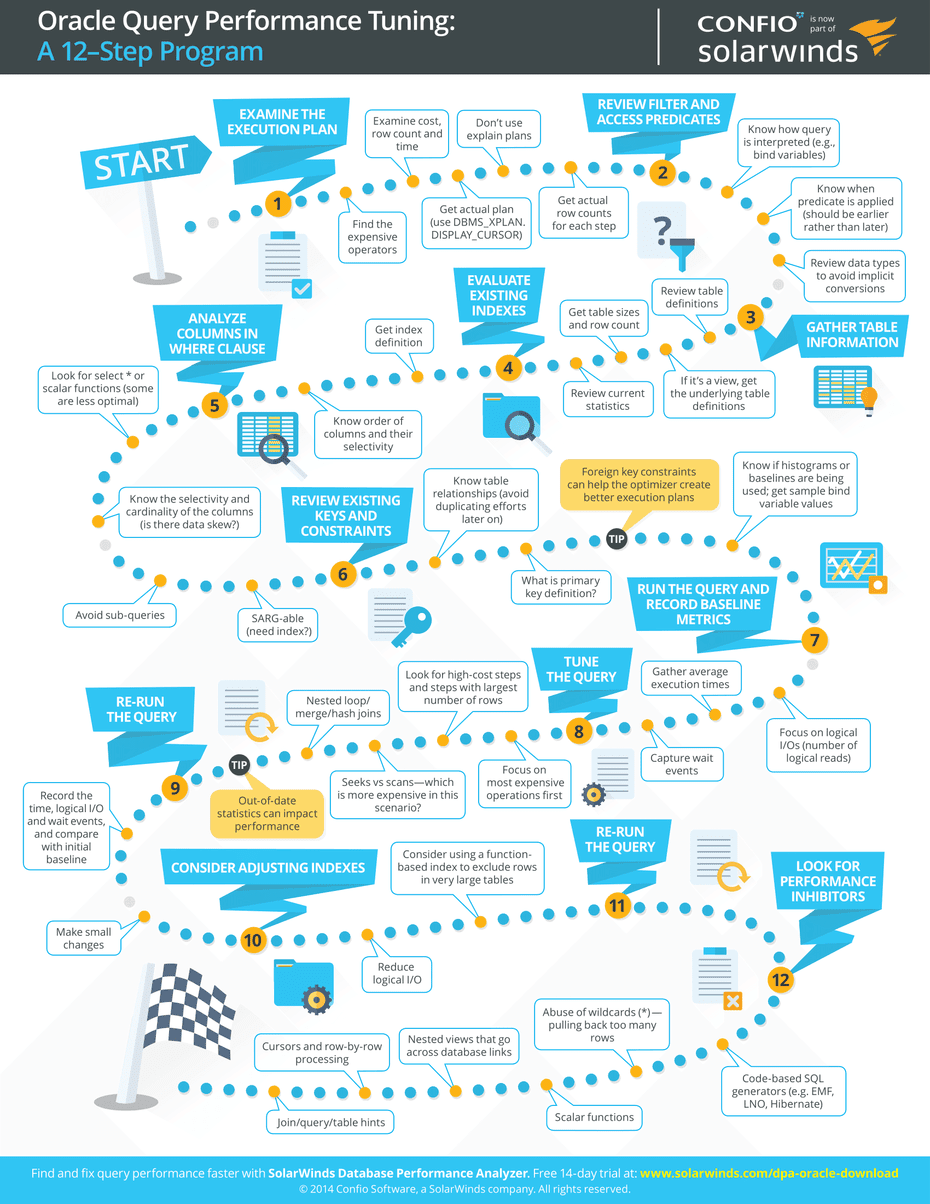
Oracle Query performance tuning :
Source :Internet.
The Database tuning, mainly contains Wait events and Hit ratios.
Explain the use of TKPROF?
The TKPROF is a tuning tool which is used to define the execution times for SQL statements and CPU. You can use it by first setting timed_statistics to be true in the initialization file and then making the tracing to turn on either for the session using the ALTER session command or the for the entire database through the SQL_trace parameter. Once you get the trace file, you can execute the tkprof tool across the trace file and then you can view at the result from the tkprof tool. It can also be used to extract explain plan result.
What is Latch Free Event?
The Latch free Event occurs when the latch is held by another process, when one process is waiting for it.
What kind of information can be obtained from summary advisor?
A summary advisor is nothing but a tool that is used for understanding and choosing materialized views. This can be achieved by choosing the appropriate set of materialized views for a specific workload and it also helps in getting information about activity log details, materialized view usage and materialized view recommendations.
What is the fastest query method for a table?
The fastest query method for a table is to fetch by using Row id.
What are the tools provided by oracle to assist performance tuning?
The following are the tools provided by oracle to assist performance tuning:
• SQL Performance Analyzer (SPA) is similar to Database replay, but with a few differences. It doesn’t perform the recording.
• Oracle Enterprise Manager (OEM) is a set of tools, which helps the management of all factors of an Oracle database instances, Oracle infrastructure, Oracle web servers and application servers.
• Statspack is provided by Oracle to perform reporting and monitoring.
• Automatic Workload Repository (AWR) is a tool that is built in every Oracle database and after every 60 minutes, it captures the snapshot of workloads and all key statistics in the database by default.
• TKProf is used to assess the efficiency of the SQL statements accurately during the application run.
Oracle Query performance tuning :
Source :Internet.
No comments:
Post a Comment